Response to TCFD Recommendations
Public Declaration of Support for Task Force on Climate-Related Financial Disclosure
Basic Stance
The major social mission of the USS Group is to run auto auctions that minimize energy consumption and greenhouse gas emissions. Work to limit the average global temperature rise benefits both the Group and society. It not only reduces risks arising due to climate change but also shapes a sustainable carbon-neutral society, which protects the environment for all life. Our public declaration of support for the Task Force on Climate-Related Financial Disclosure (TCFD) shapes the Group's approach to disclosures on governance, strategies, risk management, key performance indicators, and targets.

*The TCFD is an international initiative established by the Financial Stability Board (FSB) in 2015 to encourage companies to disclose information on the financial implications of the risks and opportunities that climate change presents to their businesses.
Information Disclosure Based on TCFD Recommendations
I. Governance
Oversight of the Board of Director
Key decisions regarding USS Group climate change issues, including transition plans (related to Governance, Strategy, Risk management, and Indicators and targets), are subject to resolution by the Board of Directors.
At least once a quarter, the Board of Directors receives a report from the President on efforts to address climate change-related issues and progress toward established goals, and monitors and supervises climate change issues. The Board of Directors makes decisions on matters deemed important by the President, such as management strategies, management plans, annual budgets, and profit targets, after considering the risks and opportunities of climate change as necessary.
Manager in charge of climate-related oversight
Matters related to climate change shall be overseen by the President. The President shall monitor and receive periodic reports on trends in emissions from each business and group company and on the progress of emissions reduction measures to achieve SBT targets, and shall be responsible for implementing the climate change issues set forth in the following items and shall provide direction for the environmental management activities of the USS Group.
(1) Conduct an assessment of the impact of climate change issues on the business (at least once a year)
(2) Develop policies and strategies to minimize identified risks and capture opportunities, and reflect them in plans, budgets, targets, etc.
(3) Development of transition plans with emission reduction targets as a pillar
(4) Establishment of KPIs on climate change issues and evaluation of progress, including review of KPI performance
(5) Reporting important matters related to climate change issues to the Board of Directors
II. Strategy
Identification and assessment of climate-related risks and opportunities
USS has identified, assessed, and prioritized climate-related transition and physical risks as well as opportunities. We have also created specific climate-related scenarios to gain even greater insight into these risks and opportunities.
Scenario analysis
USS identifies climate-related risks and opportunities with the potential to greatly impact not only our businesses but also our stakeholders. Two of our climate-related scenarios give us insight into future. The first is a low-carbon economy with a 1.5°C or lower scenario. The second is a business-as-usual scenario. Through the data (parameters) rooted in these scenarios and internal and external information, we assess the business and financial impact of climate-related risks and opportunities.
Note: Scope: Auto Auction business and its entire supply chain
Note: Target period: Now until 2050
Overview of scenario
| 1.5℃ Scenario | Business-as-Usual Scenario |
|---|---|
|
A scenario in which the entire world accelerates efforts toachieve net-zero by 2050 1. Strengthening policies and regulations ・ Setting GHG emission reduction targets ・ Full-scale implementation of a carbon tax 2. Advancements in clean energy technologies and CO2 removal technologies 3. Global expansion of electric vehicles |
Scenarios predicting future directions based on existing and publicly announced policies and technological trends 1. Increased frequency of extreme weather events and more severe impacts ・ Decline in hydropower generation capacity due to drought ・ Power grid disruptions (power outages) caused by typhoons, floods, and wildfires ・ Pressure on peak electricity demand due to rising temperatures 2. Variations in EV adoption rates by region |
Reference Scenarios
| ・IEA NZE, IEA STEPS | IEA "World Energy Outlook 2025" (https://www.iea.org/reports/world-energy-outlook-2025) |
|---|---|
| ・RCP 1.9, SSP1-1.9, RCP 8.5, SSP5-8.5 |
IPCC "AR5", "AR6" (https://www.env.go.jp/earth/ipcc/5th/)、 (https://www.env.go.jp/earth/ipcc/6th) |
Notes:
[Risk of manifestation] Short term: Within 5 years; medium term: 5 to 10 years; long term: 10 to more than 30 years
[Potential of manifestation] High: High potential; medium: 50-50; low: low potential
[Financial impact] Small: ¥100 million or less; medium: ¥100 to ¥5,000 million; large: more than ¥5,000 million
[Definition of significant impact] High potential and medium or large financial impact
Risks and Opportunities
| Type | Scenario Analysis Results | Risk of manifestation | Potential | Financial impact | Response Strategies | |||
|---|---|---|---|---|---|---|---|---|
| 1.5℃ Scenario | Transition risks | Regulatory/legal changes | An increase in energy costs brought by the adoption of European-style carbon taxes and pricing even in Japan to achieve net-zero GHG emissions | S-M | H | M | Promote on-site adoption of renewable energy (solar power generation) Shift to CO2-free electricity, Utilization of non-fossil certificates |
|
| A decline in auction sales due to lower demand for used gasoline car exports as more nations prohibit the sale of gasoline vehicles from Japan | M-L | M | L | Expansion of business portfolio to continue creating schemes for fair and honest trade and resource recycling
|
||||
| As the circular economy develops, sharing services will become more prevalent and fewer people will buy and own EVs. EV manufacturers will enclose EV distribution within their own supply chains. | S-M | M | L | |||||
| Reputation | Investment behavior based on climate change risk and the movement to require SBT certification for investment will take root and expand. | S-M | H | M | Obtained SBT certification (Obtained SBT in October 2023) |
|||
| Opportunity | Energy sources/Markets | Accelerating replacement demand from gasoline-powered vehicles to EVs for decarbonization, leading to an increase in the number of vehicles sold at our auctions | M-L | H | L | Promote measures to increase the number of EVs in our auctions
|
||
| Products and services | An increase in the number of vehicles put on auction by developing the new inspection technologies and rules driven by industries working toward zero emissions | S-M | M | M | ||||
| Business-as-Usual Scenario | Physical Risks | Physical Risks(Acute) | Suspension of business, additional costs to repair equipment, and higher insurance premiums due to damage of the auction house inflicted by typhoons or other natural disasters | M-L | L | M | Measures Under Consideration Following the Establishment of a BCP (Business Continuity Plan) Project <Key Considerations> 1. Maintenance and backup of the auction system 2. Plans for continuing and resuming auctions 3. Disaster preparedness supplies and ensuring safety during emergencies 4. Ensuring external communication channels (public relations functions) via alternative locations 5. Handling of auction payments and financial settlements, as well as other BCP-related matters |
|
| Physical Risks(Chronic) | Costs to rebuild or move the auction house on the coast due to damage caused by flooding and high tides resulting from rising sea levels | M-L | L | L | ||||
| Higher average temperature and risk of heatstroke | M-L | H | S | |||||
Impact Assessments and Response Strategies
1. Impact assessment of carbon tax introduction (Risk)
1-1) Increasing Businesses Costs Due to Carbon Taxes and Pricing
In order to achieve the Paris Agreement, Japan has made an international commitment to reduce greenhouse gas emissions by 46% by 2030 and to achieve carbon neutrality by 2050, and in order to achieve these goals, "The Basic Policy for the Realization of GX" has been announced. In the policy, the introduction of a levy on carbon has been announced, and there is a possibility of expanding the scope of the levy and increasing the level of burden in the future.
1-2) Financial Impact
USS has calculated the potential financial impact of carbon taxes (carbon pricing). The 1.5°C Scenario has a potential financial impact of ¥480 million by 2035 and ¥660 million by 2050. The Business-as-Usual Scenario has a potential financial impact of ¥100 million by 2035 and ¥280 million by 2050.
<1>Important parameters (indicators) taking into account the financial impact in 2035 and 2050
| Scenarios | 1.5℃ Scenario | Business-as-Usual Scenario |
|||
|---|---|---|---|---|---|
| Year | 2035 | 2050 | 2035 | 2050 | |
| Without achieving GHG emission reduction targets | Carbon tax (billions of yen) |
4.8 | 6.6 | 1.0 | 2.8 |
| When achieving GHG emission reduction targets | Carbon tax (billions of yen) |
2.7 | 3.8 | 0.6 | 1.6 |
| Difference | Tax liability (billions of yen) |
2.1 | 2.8 | 0.4 | 1.2 |
| Carbon tax and pricing (US$ per t-CO2) | 180 | 250 | 39 | 105 | |
(Prerequisites)
The calculation presumes Japan will put in place a carbon tax with carbon pricing equivalent to nations committed to the IEA WEO 2025 NZE net-zero pledge as well as Japan STEPS.
Conversion: Scope 1 & 2 Emissions for the Fiscal Year Ending March 31, 2022 × Carbon Tax Price (US$1 = ¥160)
1-3) Response Strategy
Use of electricity derived from renewable energy sources
As a result of conducting an impact assessment of the carbon tax, we are promoting the introduction of on-site renewable energy, which will not only enable us to achieve the emission reduction targets but also generate significant tax savings in the future.
Specifically, we are implementing the following three measures: (1) introduction of on-site renewable energy, (2) purchase of CO2-free electricity, and (3) utilization of non-fossil certificates.
<2> List of Solar Power Generation Facilities Installed
| Auction Site | R Nagoya | Nagoya | Shizuoka | JAA | Okayama | Saitama | Kobe |
|---|---|---|---|---|---|---|---|
| Operation start |
Jan 2023 | Feb 2023 | Jul 2023 | Aug 2023 | Oct 2023 | Jan 2024 | Mar 2024 |
Upgrading to high-efficiency energy-saving air conditioning equipment
In addition to utilizing electricity derived from renewable energy, we are promoting the upgrade of air conditioning equipment to the latest energy-saving equipment in order to reduce energy consumption.
2. Evaluation of effects of increasing EV sales worldwide (Risk, Opportunity)
2-1) USS forecast for the growth of EV utilization
If the use of car sharing services increases as part of measures to achieve a circular economy, there may be a decline in the number of people who own electric vehicles (EV). Another possibility is the decision of EV manufacturers to buy and sell these vehicles within their own supply chains. Either one of these events could reduce the number of vehicles consigned at USS auctions.
However, if various measures are implemented based on the goal set by the Japanese government in its "Green Growth Strategy Through Achieving Carbon Neutrality in 2050 "to achieve 100% electric vehicles in new passenger car sales by 2035, a large increase in new car sales (car replacement sales) will lead to a large increase in the number of cars auctioned at the USS auction which will likely have a significant positive impact on our earnings.
2-2) Strategic actions for combating climate change
A stronger framework for sales of EVs at auctions
The number of EVs at USS actions is certain to increase. USS is conducting R&D activities for determining EV evaluation standards, establishing an EV inspection system and other purposes.
To be specific, we became a member of Battery Association for Supply Chain, which is engaged in activities such as international standardization of the battery supply chain and construction of a battery ecosystem to realize a decarbonized society, and we are actively working with member companies to address issues such as battery diagnosis in the distribution of EVs through auctions.
Digital auction consignment forms
In anticipation of a large increase in the number of vehicles to be auctioned, USS is promoting the streamlining and digitization of its operations. Specifically, by building a system that allows members to create auction consignment data on the system, input work has been eliminated, data accuracy has improved, and operational efficiency has been achieved.
Active investment in auction facilities
We will actively invest in auction facilities to achieve our Long-term goal of a 50% share of the auto auction market. Specifically, in addition to rebuilding the Yokohama Auction side, which opened in January 2026, we are planning to rebuild Tokyo, HAA Kobe and Fukuoka Auction Site to expand our auction processing capacity. We will also be upgrading our core auto auction system.
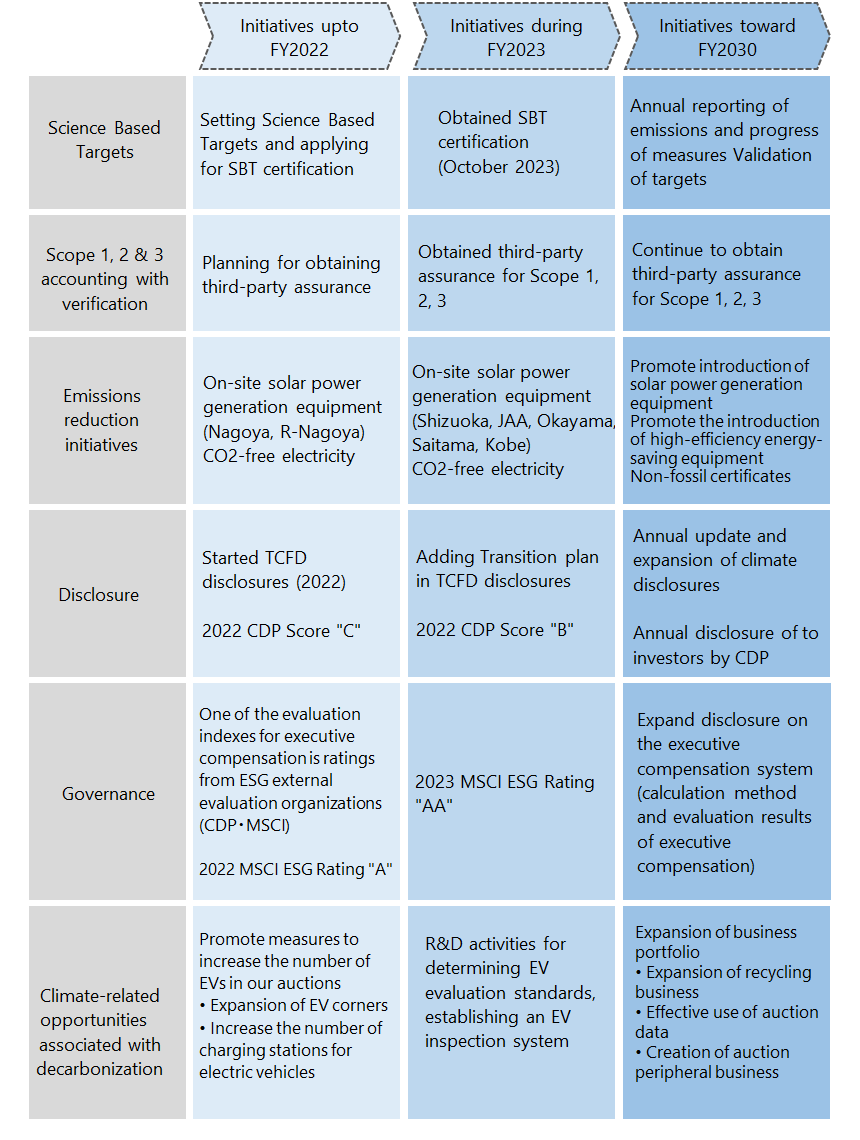
Transition Plan concerning Climate Change
The USS Group has established a Transition Plan (Roadmap) for measures to combat climate change. The implementation of this plan started in June 2023 following discussions and approval by the Board of Directors. To increase the accuracy of the transition plan, the road map that is the key element of the plan will be updated as necessary based on changes in the internal and external environment for the operations of the USS Group.
Furthermore, the Board of Directors will receive progress reports about the transition plan in order to allow the directors to supervise activities involving the plan properly.
◆Initiatives to reduce Scope 1 and 2 emissions
| Scope 1&2 | 1. Use of electricity derived from renewable energy sources |
|---|---|
| (1) Promotion of on-site solar power installation | |
| From the perspective of contributing to the decarbonization of society by adding and increasing new renewable energy sources, we are promoting the introduction of on-site PPA solar power generation facilities on the roofs of auction sites. (As of the end of March 2026: 7 out of 19 sites) | |
| (2) Purchase of CO2-free electricity | |
| For electricity that cannot be supplied by on-site solar power generation, we are promoting the purchase of electricity menus derived from renewable energy. (As of the end of March 2026: 2 out of 19 sites) | |
| (3) Utilization of non-fossil certificates | |
| In addition to on-site solar power generation and CO2-free electricity, we are implementing indirect reductions in emissions through the use of FIT non-fossil certificates from the fiscal year endedMarch 2025. | |
| 2. Introduction of high-efficiency energy-saving equipment | |
| We have reduced energy consumption by upgrading air conditioning equipment to the latest energy-efficient models. |
| Scope3 | 1. Category 11: Use of Sold Products |
|---|---|
| Among Scope 3 emissions, Category 11 accounts for the largest share, exceeding 50%, with fuel consumption from the operation of sold vehicles being the primary source of emissions.The Japanese government has set the target of achieving 100% electric vehicles (EVs) in new passenger vehicle sales by 2035. Over the next 5 to 10 years, the sales ratio of electric vehicles (EVs, FCVs, PHEVs, and HEVs) is expected to significantly increase. To accurately calculate the emissions from these electric vehicles, we are refining the calculation methods starting from the emissions for the fiscal year ending March 2025. | |
| 2. Category 2: Capital Goods | |
We will also reduce emissions in Category 2, which covers capital goods such as purchased equipment, by combining the following measures.
|
|
| 3.Other Categories | |
| For other categories, we will continue to implement measures such as electronic invoicing (Category 1: Reduction of communication costs), promotion of online meetings (Category 6: Reduction of business travel emissions), and promotion of Digital auction consignment forms (Category 5: Reduction of waste), while also actively implementing business improvements that have a reduction effect. |
III. Risk management
Framework to identify and evaluate climate-related risks and opportunities
As the manager in charge of climate-related matters, the president and representative director leads relevant departments and Group companies in identifying and understanding climate-related risks and opportunities. Our approach leverages a defined risk management framework to make headway. The president and representative director shares this progress with the Board of Directors at annual and extraordinary meetings. The Board of Directors uses these reports to monitor risk management progress as well as the initiatives and targets set to overcome various challenges.
Climate-related risk management framework
As the manager in charge of climate-related risks, the president and representative director reports and advocates initiatives to combat climate change to the Board of Directors. This includes the planning, proposal, and oversight of a risk management framework to identify, evaluate, and address its Group-wide impact. The Board of Directors has the duty to deliberate on and assess the overall risks presented by climate change using what has been learned from the reports and proposals presented by the president and representative director at these annual and extraordinary meetings. The Board of Directors will also create risk management policies and strategies to minimize risks from a Group-wide perspective. It will also properly incorporate those policies and strategies into plans, budgets, and targets.
IV. Indicators and targets
The USS Group has set a CO2 emissions reduction target equivalent to the SBT standard as a goal to be used in managing climate-related risks and opportunities, and has obtained SBT certification in October 2023
To achieve this goal, we have set a target for the ratio of electricity derived from renewable energy sources and are working to reduce GHG emissions by introducing on-site solar power generation equipment, switching to CO2-free electricity, and installing high-efficiency energy-saving equipment.
| Items | Targets | Base year |
|---|---|---|
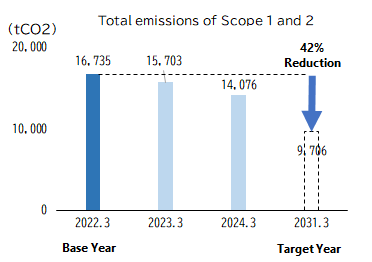
| Total emissions of Scope 1 and 2 | 42% reduction by FY3/31 | FY3/22 |
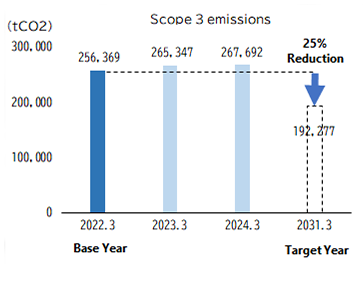
| Scope 3 emissions | 25% reduction by FY3/31 | |
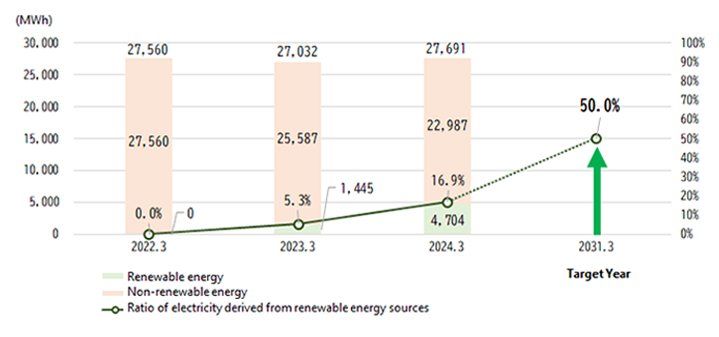
| The ratio of electricity derived from renewable energy sources | 50% by FY3/31 | - |
GHG emissions
Electricity consumption & Ratio of electricity derived from renewable energy sources
Third-party Assurance
Independent Assurance Report
To enhance the reliability of the ESG data disclosed, CO2 Emissions data have obtained third-party assurance.
Other Data on Climate Change
CO2 Emissions throughout the Value Chain
| Classification | Scope of calculation | CO2 emissions(t-CO2) | ||||||
|---|---|---|---|---|---|---|---|---|
| FY2021 | FY2022 | FY2023 | FY2024 | |||||
| Emissions of the USS Group's business sites |
Direct emissions (Scope 1) |
Use of fossil fuels | 4,138 | 3,966 | 4,269 | 4,404 | ||
| Indirect emissions (Scope 2) *Market-based |
Purchased electricity and heat use | 12,597 | 11,737 | 9,807 | 9,462 | |||
| Total of Scopes 1 and 2 | 16,735 | 15,703 | 14,076 | 13,866 | ||||
| Upstream and Downstream emissions |
Other indirect emissions (Scope 3) |
Category | 1 | Resource extraction, manufacturing and transportation related to purchased goods/services | 68,565 | 73,520 | 87,669 | 86,409 |
| 2 | Manufacturing and transportation of capital goods such as purchased equipment | 17,654 | 13,502 | 6,784 | 9,271 | |||
| 3 | Resource extraction, manufacturing and transportation related to purchased fuels/energy | 2,727 | 2,562 | 2,164 | 2,738 | |||
| 4 | Upstream transportation and distribution | 6,248 | 6,648 | 6,648 | 6,391 | |||
| 5 | Disposal of wastes discharged from business sites | 3,149 | 5,515 | 5,160 | 6,458 | |||
| 6 | Employee business travels | 166 | 146 | 147 | 153 | |||
| 7 | Employee commuting | 1,605 | 1,722 | 1,681 | 1,678 | |||
| 8 | Operation of assets leased to the USS Group | Not applicable | Not applicable | Not applicable | Not applicable | |||
| 9 | Downstream transportation and distribution | 2,838 | 3,531 | 3,679 | 3,801 | |||
| 10 | Processing of intermediate products | Not applicable | Not applicable | Not applicable | Not applicable | |||
| 11 | Use of sold products | 149,778 | 154,731 | 150,049 | 148,318 | |||
| 12 | End-of-life treatment of sold products | 1,609 | 1,370 | 1,520 | 1,563 | |||
| 13 | Operation of assets leased to other entities | Not applicable | Not applicable | Not applicable | Not applicable | |||
| 14 | Operation of franchises | 2,030 | 2,101 | 2,190 | 2,174 | |||
| 15 | Investments | Not applicable | Not applicable | Not applicable | Not applicable | |||
| Total of Scope 3 | 256,369 | 265,347 | 267,692 | 268,954 | ||||
| Total of Scopes 1, 2, and 3 | 273,104 | 281,050 | 281,767 | 282,819 | ||||
| (Reference) Scope 2 Location-based | 11,933 | 11,732 | 12,129 | 12,027 | ||||
*1. Scope: USS Co., Ltd. and all the group companies (100% coverage ratio to consolidated sales)
*2. Period: Fiscal year (April-March)
*3. Guidance: The GHG Protocol "Corporate Accounting and Reporting Standard" & "Corporate Value Chain (Scope 3) Accounting and Reporting Standard", Basic Guideline for calculating greenhouse gas emissions throughout the supply chain (ver. 2.6), IDEA v.2, etc.
*4. Database:
*5. Totals shown may differ from the simple sum of values shown due to rounding.
*6. CO2 emissions shown as "not applicable" correspond to zero.
Energy Usage
Boundary: All USS Group sites (100%).
| Energy | Unit | FY2020 | FY2021 | FY2022 | FY2023 | FY2024 |
|---|---|---|---|---|---|---|
| Gasoline | kl | 582 | 585 | 564 | 605 | 671 |
| Diesel Oil | kl | 743 | 617 | 572 | 621 | 613 |
| Kerosene | kl | 107 | 79 | 80 | 111 | 85 |
| LP Gas | t | 260 | 268 | 262 | 268 | 279 |
| Natural Gas | Thousand Nm3 | 82 | 84 | 89 | 87 | 105 |
| Electricity(Non-renewable energy) | MWh | 28,837 | 27,560 | 25,587 | 22,987 | 21,365 |
| Electricity(Renewable energy) | MWh | - | - | 1,445 | 4,704 | 7,068 |
| Total | MWh | 48,001 | 45,278 | 44,056 | 45,677 | 47,038 |
Evaluation of Energy Reduction Activities External Organizations
For the seventh consecutive year, starting in FY3/2017, USS was classified as an outstanding energy conservation company (class S) under the business classification system for energy conservation measures. The Japanese Ministry of Economy, Trade and Industry assigns one of four classes (S, A, B, C) to all companies that submit periodic reports prescribed by the Energy Conservation Act. We will continue to use a broad range of energy conservation activities in order to retain our S rating. *URL for more information about this evaluation system https://www.enecho.meti.go.jp/en/